


|
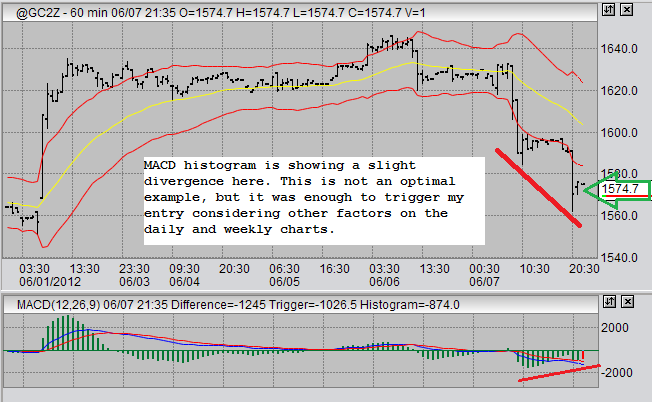
Gold Trading 2012-06-07Gold trading and gold prices have recently seen some interesting activity. The activity has been interesting enough to prompt me to enter into a trade. Long entry into December gold futures occurred June 7 at 21:41 at a price of 1573.4. We will look at two gold futures trading charts, one 60 minute demonstrating precise entry and on daily demonstrating my general market analysis. I have been anticipating a potential change in trend in gold futures. I believe that we may be beginning to see the initial stages of this change in gold price. Last week we saw strength on Friday. This week prices have declined in what could be a test of support, or some type of "shakeout". As usual, I am utilizing a safety stop. If my gold trading analysis is incorrect or ill-timed, then I will be stopped out at a predetermined acceptable loss. However, I am now of strong enough opinion that I want to be in the market in anticipation of the gold price directional change I believe we will see. Following is a 60 minute gold price chart demonstrating my entry point.
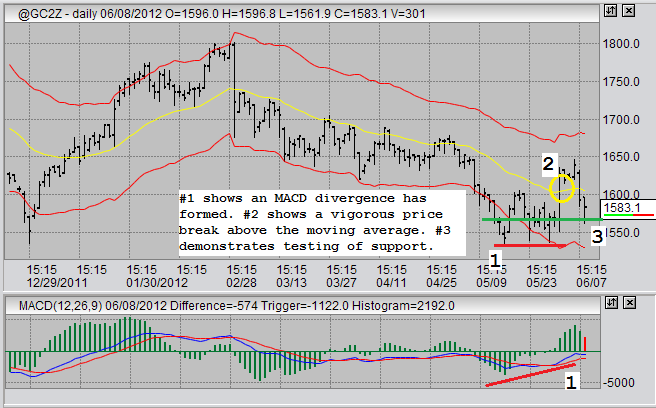
What we are observing in this 60 minute gold futures trading chart is a fairly loose MACD divergence. It is "loose" at best. I don't like it, and I wouldn't trade it on its own. However, I was already looking for a buy in this specific price zone at this specific time based on daily and weekly chart analysis. In my experience MACD divergences on 60 minute gold charts are never that well formed to begin with. In addition, this chart is for the December contract for gold futures, which means that charts and patterns will be more loosely formed due to lower volume and liquidity that would be apparent on the front-month chart. In this case that would be August. Next, let us look at the daily gold trading chart. The daily chart demonstrates much more clearly why I entered in this particular price area at this particular time.
What we are seeing here is a series of three events that prompted my decision to execute a long entry. At #1 we see an MACD divergence. Prices tested the 1535 price area three times, each time MACD was a little less low in both the histogram and the moving averages. At #2 we see price strength vigorously pushing past and closing above the moving average. This shows us that there is interest in higher gold prices. Some folks might interpret this as a short squeeze. Either way, somebody did a lot of buying. At #3 we see prices retest previous support. This is where I wanted to buy, and this will be the determining test to see if this trade will continue or not. If this bounce fails to stay bounced, then my stop will be triggered and my position will be neutralized. If this bounce holds in its upper daily range and through next week, then we could very well be seeing the beginning of a sustained upward price dynamic in gold prices. This would be what I am looking for. This gold trading execution is a buy and hold trade for me. I do not have a specific exit target, except in the case of losses where I will be stopped out. It is a December contract, so at some point I will be forced to liquidate in the next 6 months. Ideally I would like to see prices steadily climb between now and then. I will be monitoring weekly charts. If I see topping sell signals on either weekly or daily charts I will exit and look for reentry along a moving average on weekly charts. In other markets, I am continuing to watch sugar very closely for intraday trading opportunities. As usual, I am also watching the USDX fairly closely for other intraday trading on 60 minute charts. Go to Contact Us |
Market Commentary:
Due to site updates, all RECENT POSTS CAN BE VIEWED HERE
2012-06-22 TRADE US Dollar
2012-06-21 TRADE Gold, Sugar
2012-06-18 More on Gold
2012-06-12 Gold Update
2012-06-12 TRADE Dollar Index
2012-06-11 TRADE US Dollar
2012-06-07 TRADE Gold
2012-06-06 TRADE Sugar
2012-06-05 TRADE US Dollar Index
2012-06-02 Sugar Update, USDX, Gold
2012-05-30 Sugar Update, TRADES
2012-05-26 Sugar, USDX
2012-05-24 TRADE USDX
2012-05-18 Sugar
2012-05-15 TRADE Sugar
2012-05-14 TRADE US Dollar Index
2012-05-14 Copper & Gold
2012-05-13 Trading Corn
2012-05-07 TRADE Corn
2012-05-02 TRADE Sugar
2012-04-30 TRADE Dollar Index
2012-04-26 TRADE July Oats
2012-04-21 GBP Short, Gold, AUD
2012-04-14 Sugar Gold AUD/USD
2012-04-10 TRADE Australian Dollar
2012-08-09 TRADE Gold
2012-04-08 Trading Gold Futures
May Sugar Futures: 2012-03-19
2012-03-18 Japanese Yen
2012-03-11 T-Bonds, DX Long, AUD/USD Short
2012-02-26 GBP/USD and USDX Reversals
2012-02-21 Index Reversal?
2012-02-17 GBP & CAD Reversal?
2012-02-16 Gold Prices
2012-02-14 US Dollar Index
2012-02-10 Market Reversal?
New! Comments