


|
Let us review the situation with gold futures. We saw some very interesting action today. I had entered into a long gold trade late last week. You can see the details of that particular trade in this gold trading blog entry. I had observed an MACD divergence occurring over the previous month or so, and finally I had decided to act on a pull back after the MACD divergence had resulted in the strong upward price movement on Friday, June 1. The pullback occurred a week later on Friday, June 8. Since my long entry, prices have performed well giving further credibility to the idea of a trend reversal. Let us observe the daily futures chart for the December gold contract. This is a screenshot of the the price chart 30 minutes after close of Tuesday, June 12. 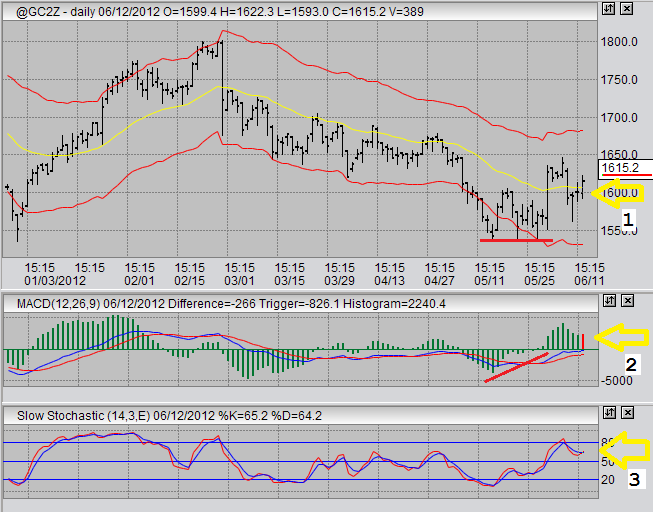
First notice the thicker red lines indicating the MACD divergence (they are the short ones, not the thin red channel lines). To learn more about MACD divergences and divergence trading, click this link to MACD divergence. We then see the strong upward price thrust on Friday, Jun 8. A week later we see the retracement into the 1560 area. It was low on this retracement that I made my long entry. Specifically, I bought at 1573. What we see today is that prices have once again crossed above the moving average. This is indicate by a #1 on the chart. The notion that this is giving more strength to a potential full reversal in trend is further ratified by the MACD. Notice how the MACD histogram has ticked up a bit above yesterday's MACD histogram, this is marked by a #2 on the gold chart. Ideally what we would like to see here is for prices to match or exceed the recent price highs in the next week or so, while simultaneously seeing the MACD histogram exceeding its highs of last week. We want to see higher highs in price, and higher highs in the MACD to get good confirmation of growing price strength in gold futures. Further, notice the Stochastic. The fast line has crossed above the slow line marked by #3, although just barely. If tomorrow is not a down day, then chances are this crossing will become quite clear. This will further ratify an impending continued upward direction for gold prices. At the time being, I have no intention of liquidating my gold position soon. I am hoping for continued upward price movement over several weeks. When I begin to see topping formations either by COT, daily, or 60 minute charts, I will liquidate and look for re-entry for a longer price trend. Alternatively, I will be wrong and get stopped out above my break even. I am using a very loose stop here, because I want to avoid getting stopped out prematurely as I do believe this will be a continued price movement. Go to Contact Us Go from Gold Futures to the Home Page |
Market Commentary:
2012-06-12 Gold Update
2012-06-12 TRADE Dollar Index
2012-06-11 TRADE US Dollar
2012-06-07 TRADE Gold
2012-06-06 TRADE Sugar
2012-06-05 TRADE US Dollar Index
2012-06-02 Sugar Update, USDX, Gold
2012-05-30 Sugar Update, TRADES
2012-05-26 Sugar, USDX
2012-05-24 TRADE USDX
2012-05-18 Sugar
2012-05-15 TRADE Sugar
2012-05-14 TRADE US Dollar Index
2012-05-14 Copper & Gold
2012-05-13 Trading Corn
2012-05-07 TRADE Corn
2012-05-02 TRADE Sugar
2012-04-30 TRADE Dollar Index
2012-04-26 TRADE July Oats
2012-04-21 GBP Short, Gold, AUD
2012-04-14 Sugar Gold AUD/USD
2012-04-10 TRADE Australian Dollar
2012-08-09 TRADE Gold
2012-04-08 Trading Gold Futures
May Sugar Futures: 2012-03-19
2012-03-18 Japanese Yen
2012-03-11 T-Bonds, DX Long, AUD/USD Short
2012-02-26 GBP/USD and USDX Reversals
2012-02-21 Index Reversal?
2012-02-17 GBP & CAD Reversal?
2012-02-16 Gold Prices
2012-02-14 US Dollar Index
2012-02-10 Market Reversal?