10 Year Treasuries 2012-07-15
I am considering a 10 year treasuries trade. I have been looking at COT data in this market an inclination to take a short trade. I will demonstrate why I am entering now on a 60 minute chart in the September contract for this product. Prices have been trending upwards on both the weekly and the daily charts, and I am looking for a return to the 52 week moving average on the weekly chart. Prices are quite high off the moving average right now. The daily chart is showing a divergence on the MACD. You can easily pull up a chart on any charting website or the cmegroup.com website and apply the MACD to see this divergence. There is a previous top at 135-000 and prices are now in that range again, only with lower MACD values. By combining my selling inclination from the COT and the distance from the moving average on the weekly chart, and then this divergence on the daily chart, I have found an entry point using the 60 minute charts.
Here is the 60 minute chart for the September contract of 10 year treasuries.
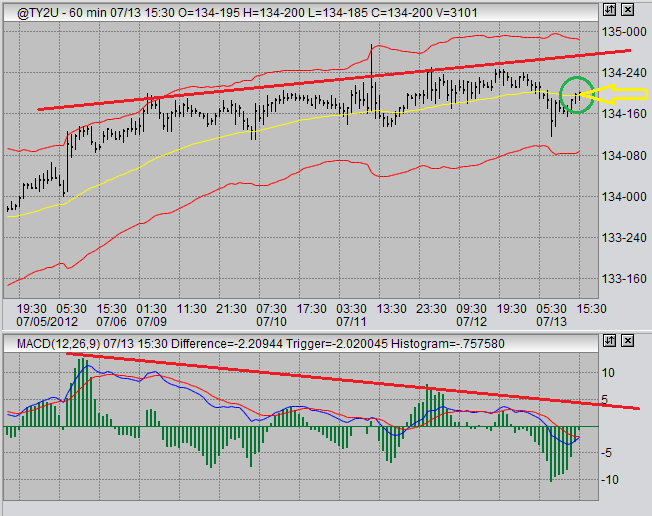
What we are observing in 10 year treasuries is a gradual rising of prices into the 135-000 area. While prices have been rising, MACD has been making lower highs. This is indicating a potential price reversal in this 60 minute time frame. Ideally, if this occurs, it will continue to carry over into the daily and then weekly time frames for the return to the weekly MACD that I am looking for. In this instance that may be in the 130-000 to 131-000 range.
Prices on the 60 minute do appear to be making that price reversal, as they penetrated sharply below the moving average on the 60 minute chart on lower MACD values. Prices have returned to the moving average and this is where I intend to sell short on Sunday evening. I will be looking for a short entry at 134-200, with a stop above recent highs. I am somewhat unsure of this trade, as I have found treasury prices to often behave skittishly with sharp swings. However, without taking risks there is little opportunity for gain. I am now feeling my opportunity, and I am taking my calculated stop-protected risk on a short trade.
In other markets, I am still bullish on sugar. In fact, after exiting my previous position, I re-entered at 22.68 on Friday. I saw a topping MACD divergence on the 60 minute charts, and I did not see a strong downward follow through. I then decided to re-enter into a long position after prices returned above my moving average on the 60 minute charts. The daily MACD is still very strong, and so I was easy to sway into bullish sentiment and forego patience for an MACD divergence entry in this market. As always, I have a protective stop limiting my potential losses should my analysis prove to be incorrect.
Go to Trading Strategies
Go to Contact Us
Go from 10 Year Treasuries to the Home Page


Futures Trading Blog Posts
posts listed chronologically below
Ads:
LATEST TRADES...
2012-10-15 Natural Gas Futures
2012-09-25 Natural Gas, Sugar update
2012-09-09 Natural Gas, DX, GC, SB
2012-07-18 TRADE: US Dollar Index
2012-07-02 TRADE: Australian Dollar Futures
2012-06-27 TRADE: Sugar Futures
New! Comments