Futures Trading the US Dollar index, Sugar, and Gold
I'm going to talk about futures trading the US Dollar index futures, gold futures, and sugar futures. I'd like to mention that I am currently experimenting with Ninja Trader. I am not trading on it at this time, but I am learning how to use it. As a result, it will appear on my weekly charts accompanying my daily and 60 minute charts that are shown on the Firetip trading platform. I would also like to state that none of the below are trades, but they are analysis that I am considering in potential trades over the upcoming days or weeks.
First, let us examine the US Dollar index futures trading chart for which I am long biased. The first chart will be in the weekly time frame, the second chart in the daily time frame, and the third chart in the 60 minute time frame. All charts are for September US Dollar futures.
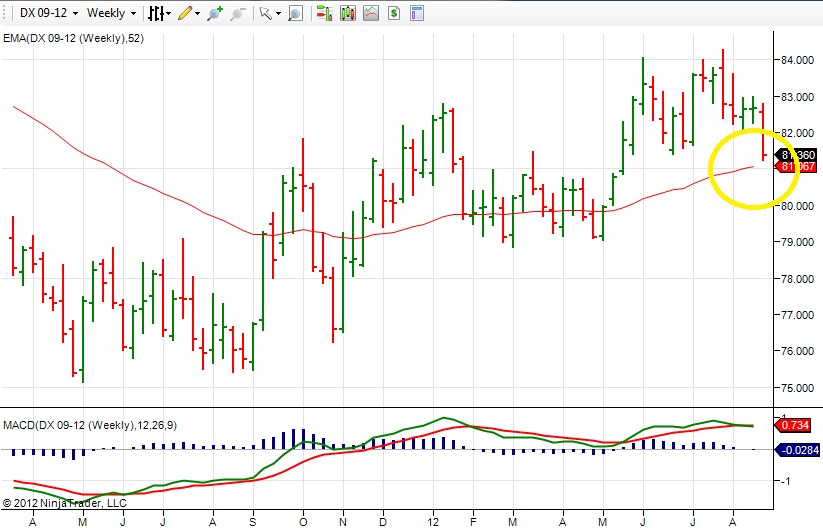
What we are seeing is that about a year ago there was a very nice MACD price divergence that occurred between May and September of 2011. USDX prices have been in an uptrend since, and I do not believe they have topped out yet. Although, with this QE3 talk, who knows what will happen. Looking at this chart, we can observe that prices are currently very near to the moving average that I have plotted on the weekly time frame. This moving average has been a source of support, with only slight penetrations over the past year. What does this tell me? It is time to look for entry opportunities on the short time frames.
Below is the daily futures trading chart for the USDX.
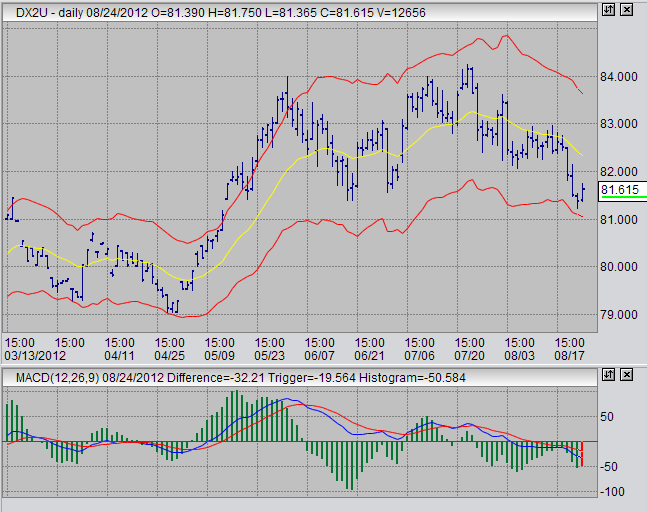
Here we see prices finding some support around the 81.50 area, which is more or less consistent with the moving average support we were seeing on the weekly chart. On this daily chart, I do not see the type of MACD divergence signal that I like, yet. However, that does not mean that an entry opportunity does not exist. There have been instances in the past where there was an entry signal on the weekly and 60 minute charts only, leaving the daily chart bare of signals (signals that I use). I am looking for an MACD divergence signal here, and it may come in the following weeks.
Let us now look at the 60 minute futures trading chart for the September contract of the US dollar index.
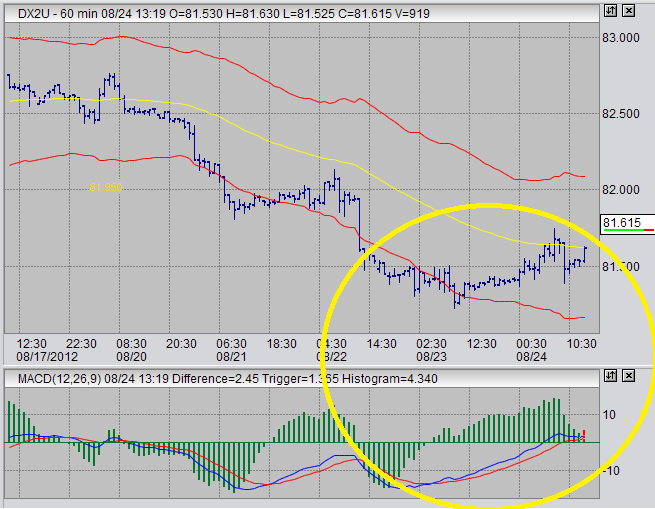
What I have circled on this chart is what I see as a situation that could develop into an MACD divergence. I will be watching this product very closely next week. I am almost expecting that next week a strong MACD divergence signal will come up in the 60 minute time frame of the USDX. This combined with the support we saw on the daily chart at 81.50, plus being so near to the moving average on the weekly chart, will prompt me to enter a trade. Like I said, I will be watching this very closely next week, and if I see an MACD divergence signal on the 60 minute time frame I will almost certainly place a trade to the long side.
Let us now examine sugar futures for which I have a long bias. The following charts are, as with the USDX charts, starting with a weekly chart, then a daily chart, then a 60 minute chart. All futures trading charts are for October sugar futures.
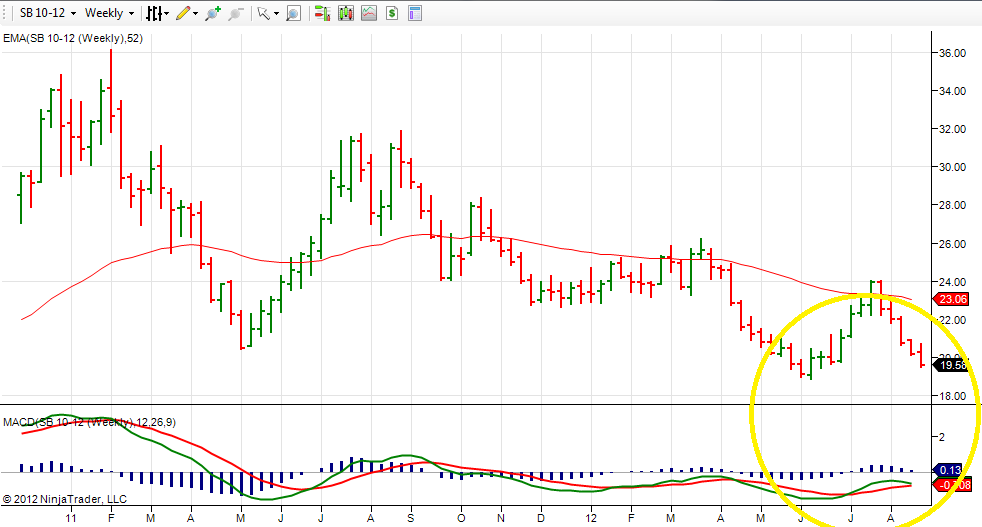
What we are seeing here are prices beginning to approach the last recent low in the 19.00 area. Notice that the MACD is above where it was during the last low. This situation could develop into an MACD divergence if prices challenge the last low, while MACD remains above its last low. I will be watching this keenly over then next few weeks.
Let us now observe the daily futures trading chart for October sugar futures.
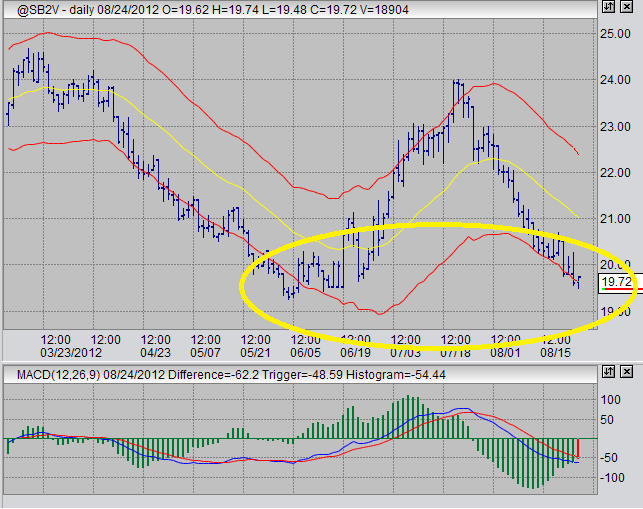
Here we have a close up look at prices challenging the last lows in the upper 19's. In the case of sugar, I will be hesitant to enter a longer term position until and MACD divergence has been established in this time frame. This could quite possibly occur over the next month. You can see a nice example of an MACD price divergence on this daily chart by examining the previous low, which is shown on this chart.
Let us now observe the 60 minute futures trading chart for October sugar futures.
Here we can see two MACD price divergences in a row. I traded the first one, making a little money. I have not traded the second one. This is telling me that downward momentum is slowing. However, I am still expecting prices to make lower lows so I am going to play the patience game with sugar until an MACD divergence is shown on the daily chart time frame. But make no mistake, I am watching this product very closely for long entry and I may be enticed into a long entry based on 60 minute signals.
Let us now examine gold futures, for which I have a long bias. In the case of gold, we will only look at one weekly chart. The chart shown below is for December gold futures.
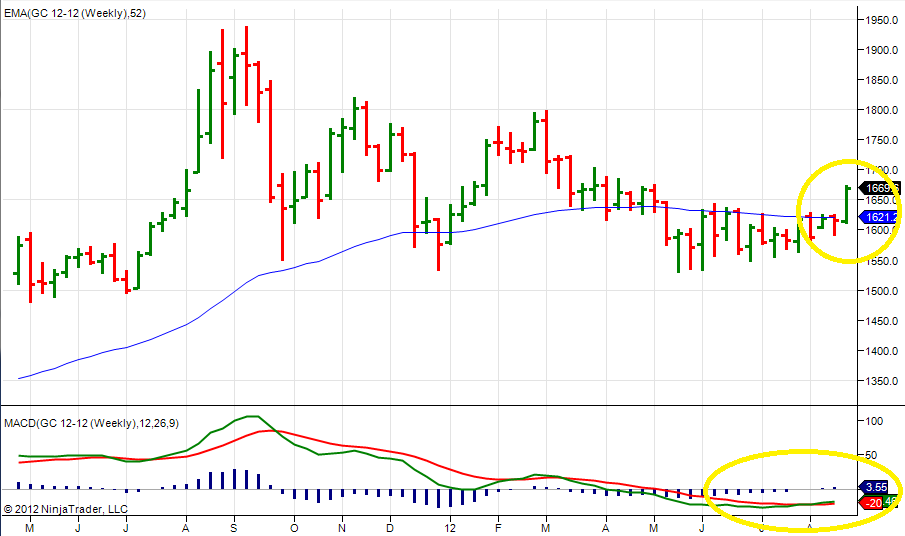
Here we see gold prices have spent essentially the entire summer below the moving average. In recent weeks we saw the MACD cross bullishly. Prices this week, until the time of this writing, have burst through the weekly moving average. I have been somewhat expecting something like this. I tried to trade it earlier in the summer, but it was lagging and I exited my position. But I am still generally looking for a long entry here. I am going to wait and see if, over the next month or so, prices rise a little more, and then return to the weekly moving average. Any return to the moving average after next week will indicate a long entry opportunity for me for a longer term trade.
In conclusion, I have stated that I have a bullish attitude on the US dollar, but I am waiting for a signal which I may see next week. I am bullish sugar, but I am waiting for a signal that I may seen within the month. I am bullish on gold, and also waiting an entry opportunity in the next several weeks. In addition, I am trying to get comfortable with Ninja Trader. I don't think I will use it for trading, but I like it for weekly and daily charting analysis. My trading platform, that I really like trading from, is well suited for my 60 minute entry analysis but not so well suited for weekly analysis. In addition, it sometimes gives headaches on the daily charts.
Ads:
Go to Trading Strategies
Go to Reviews for additional learning materials
Go to Contact Us
Go from Futures Trading the Dollar Index, Sugar, and Gold to the Home Page


Futures Trading Blog Posts
posts listed chronologically below
Ads:
LATEST TRADES...
2012-10-15 Natural Gas Futures
2012-09-25 Natural Gas, Sugar update
2012-09-09 Natural Gas, DX, GC, SB
2012-07-18 TRADE: US Dollar Index
2012-07-02 TRADE: Australian Dollar Futures
2012-06-27 TRADE: Sugar Futures
New! Comments